📊 Active Systems for November 7th


❓This section highlights line moves where the market shows strong agreement with the favored side. These are not reverse line moves. Instead, the public and big money are backing the same team, and the line is moving in their favor. When books don’t push back against the action, it often signals real strength. These are consensus-backed plays with no signs of sharp resistance, just clear support from both the public and respected money.
🏈 Houston Cougars -1.5
📊 Public/Handle Split: 57% of public 🎟️ / 50% of money 💵
🔍 Line Movement Overview
This Houston line movement shows early sharp interest, a midweek stall, and strong late confirmation at the current price.
Opening and early movement → Houston opened near +1 and was quickly bet to +1.5 and then flipped to -1. The first burst of money came fast and heavy, sending the line through zero in a clear sharp reversal. Ticket count was balanced, but handle spiked over 70%, confirming that larger bets drove the adjustment.
Midweek stabilization → Between 11/3 and 11/5, the line held around -1 to -1.5. Ticket share stayed in the 55–60% range, while money gradually declined toward 45%. This flattening phase shows the market digesting earlier sharp moves with no appetite for a correction back to the dog side.
Late activity → On 11/6–11/7, money share jumped sharply back above 75% without a line increase. That suggests renewed sharp buying on Houston with books holding firm instead of chasing the price. When a majority of handle piles in and the number doesn’t climb, that’s quiet validation of the side.
Current setup → Houston -1.5 with balanced tickets but a heavy money edge. Line remains stable even after a full flip from underdog to favorite.
Read → The market flipped on sharp steam early, then reinforced that position late. Books have consistently respected Houston, holding the line despite heavy handle. Houston -1.5 remains the sharper side with professional support at multiple stages.
🧠 Matchup Breakdown
Houston offense: QB Conner Weigman (64.9%, 1,890 yards, 16 TD, 4 INT) leads an efficient attack averaging 6.0 yards per play. Amare Thomas and Tanner Koziol combine for 1,138 yards and 12 touchdowns. RB Dean Connors adds 657 yards at 5.2 per carry. The Cougars score on 12th-ranked red-zone rate nationally and convert 48% on third downs.
Houston defense: Allows 21.6 PPG and 338.8 yards per game. Strong against the run (3.6 YPC allowed) and disruptive at the line, led by Eddie Walls III (5.5 sacks) and Jalen Garner (58 tackles).
UCF offense: QB Tayven Jackson (63.4%, 1,334 yards, 5 TD, 4 INT) has struggled with pressure and accuracy. The Knights average 191 rushing yards per game but rank bottom-tier on third downs and red-zone efficiency.
UCF defense: Strong statistically (18.8 PPG allowed, 307.8 YPG), but skewed by weak competition. Their 11th-ranked pass defense hasn’t faced a balanced top-30 offense like Houston since September.
🔥 Heatmap
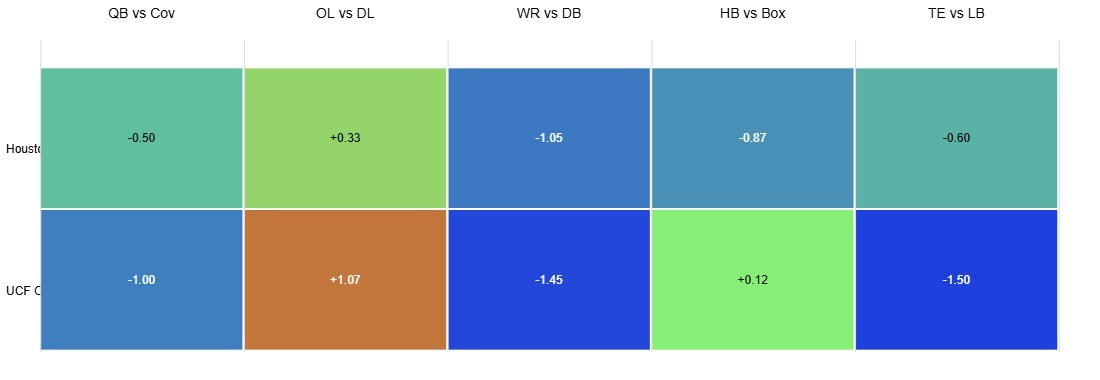
What it shows
• Each column is a key matchup, QB vs Coverage, OL vs DL, WR vs DB, HB vs Box, TE vs LB.
• Each row is a team offense vs the opposing defense.
• Colors show matchup strength. Bright green is advantage. Dark blue is disadvantage.
Our Matchup
• Houston offense: QB −0.50σ, OL +0.33σ, WR −1.05σ, HB −0.87σ, TE −0.60σ.
• UCF offense: QB −1.00σ, OL +1.07σ, WR −1.45σ, HB +0.12σ, TE −1.50σ.
• Houston shows neutral-to-positive trench strength (+0.33 OL vs DL) but clear inefficiency outside.
• UCF is similar: strong OL (+1.07) but steep negatives in WR and TE matchups.
• Both teams have limited explosiveness through the air.
Betting takeaway
• The matchup tilts slightly toward Houston in balance, with fewer severe negatives.
• UCF’s offense relies almost entirely on line play. If the pocket collapses or run lanes close, production fades fast.
• Both teams grade below average in QB/WR categories, pointing to an under-style game script.
Read
This is a matchup between two offenses trying to hide their passing flaws. Houston has modest trench support but lacks perimeter punch. UCF’s OL is a bright spot, but the rest of the map is dark blue. Expect both sides to stall in long-yardage spots and lean on short, safe plays. Houston’s balance gives them a slim advantage.
🔗 Component Contributions
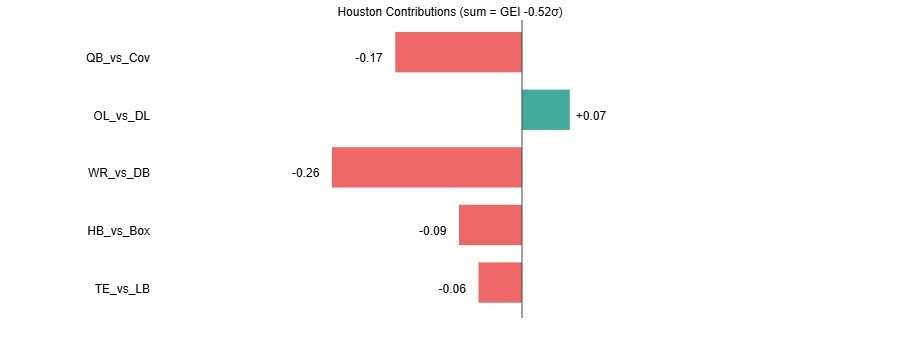
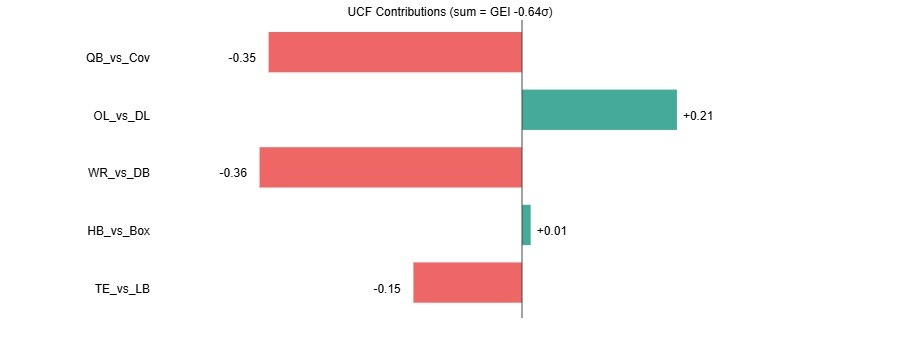
What it shows
• Each bar is how much that matchup contributes to the team’s total GEI.
• Longer bars mean stronger impact.
• Positive bars are advantages. Negative bars are weaknesses.
Your results
• Houston GEI −0.52σ (QB −0.17, OL +0.07, WR −0.26, HB −0.09, TE −0.06).
• UCF GEI −0.64σ (QB −0.35, OL +0.21, WR −0.36, HB +0.01, TE −0.15).
• Houston’s negatives are moderate, spread across several units.
• UCF has a single strength in OL, but deeper cuts from QB and WR drag the total further.
Betting takeaway
• Both teams are inefficient, but Houston’s smaller negative sum shows more stability.
• UCF’s GEI pattern is top-heavy, overly reliant on line play. That structure breaks under game pressure.
Read
The bars reveal the difference between “average and uneven.” Houston’s chart is below zero, but consistent across units. UCF’s is polarized, one strong line unit against a series of weak passing components. On the field, that imbalance means Houston can stay afloat longer, while UCF’s drives are boom-or-bust.
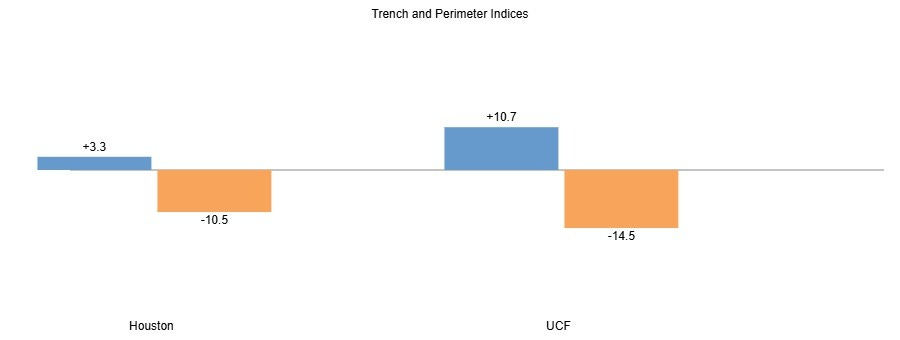
🧱 Trench and Perimeter Indices